Production Charts
Production charts, once generated, lay out the quantities of inventory and menu items that need to be ready to serve for each time period. Production Charts lets you create and customize the basic framework for your production charts.
Production charts are of two types:
-
Build-To charts provide the total demand for each item for each interval. Build-to figures need to be reviewed at the beginning of the interval, and sufficient quantities need to be prepared to meet those figures.
It’s important to note that build-to figures do not represent the number of items to prepare. To determine the preparation amount (need), you must first subtract any items already ready (on hand) from the build-to figures.
-
To illustrate, if the build-to figure for an item in an interval is 10, ensure that 10 of those items are ready for service. If you already have 2 of the items ready (on hand) from the previous interval, you need to prepare 8 more (need) so that you meet the build-to figure.
We suggest you use this chart type for items whose shelf life is equal to or greater than the chart intervals The length of the period into which each day is broken down to. The demand is calculated by Clearview for each of these periods..
-
-
Hold-At charts provide the average demand per shelf life of the associated item. Hence hold-at figures are the minimum balance of each item that should be maintained for the period.
Hold-At figures are different from build-to figures in that the figure does not need to be met just once during the interval, but maintained continuously throughout the period.
-
To illustrate, if the hold-at figure for an item for a particular period is 7 and an order comes in for 3, as soon as the three items are sent out, you need to prepare 3 more to maintain the hold-at figure.
We suggest you use this chart type for items whose shelf life is less than the chart intervals The length of the period into which each day is broken down to. The demand is calculated by Clearview for each of these periods..
-
-
By Interval: This option breaks the day down by the interval selected, hence the Chart Intervals, Start Time and End Time will remain the same for all items in the production chart.
-
User Defined: This option lets you customize the breakdown of the day for each item. You can hence have unequal intervals for an item, have the demand start and end at different times for different items, etc. The example shown on this page will use this option.
-
Create a New Production Chart
You can create any number of production charts, providing you with the opportunity to organize your charts based on different menus, types of items, or anything else that suits your requirements.
Production charts are highly configurable, and the options chosen in each of the tabs will affect how the chart is rendered in CLEARVIEW. The example shown on this page will illustrate the relationship between the selections made in the Basic Details and Item Options tabs. Specifically, User Defined Demand Frequency and Min per Item per Interval are used. This will cause the Frequency and Min column to display. Other options will require similar configurations to those shown here, as described in subsequent steps.
-
Go to Production Charts settings.
-
Click on the Create button.

-
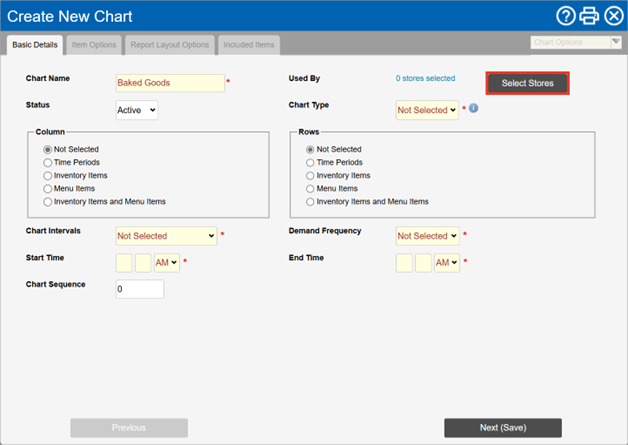
In the Basic Details tab of the Create New Chart window:
-
Enter a name for the chart in Chart Name.
-
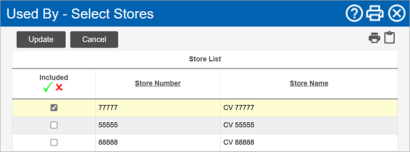
Click on the Select Stores button.

-
Place a checkmark next to each store that will use the chart in the Used By – Select Stores page.
-
Click on the Update button.
-
Set the Status to Active to include the chart in those that can be generated on the Production Charts page, or Inactive to activate it later.
-
Select the Chart Type from the drop-down list.
-
Select whether you want to include only Inventory Items, only Menu Items or both (Inventory Items and Menu Items), in the Column or Rows section, to set it as the columns or rows of the chart, respectively..
-
Select Time Periods in the Column section if the items in g were set in the Row section, or in the Rows section if the items in g were selected in the Column section.
-
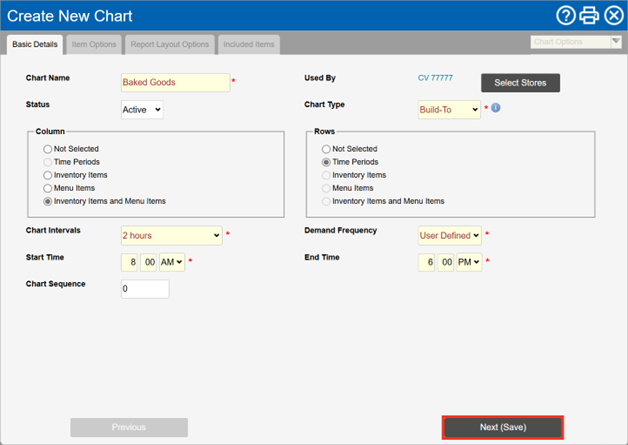
Select the duration of each period in Chart Intervals.
-
Select the Demand Frequency:
-
By Interval: The demand will be calculated every interval of the chart.
-
User Defined: The demand will be calculated based on the intervals you select.
-
-
Set the Start Time and End Time for which you want to create the production chart.
-
Enter a number in Chart Sequence (this number determines the order in which the categories will appear in the drop-down list).
-
Click on the Next (Save) button.

-
-
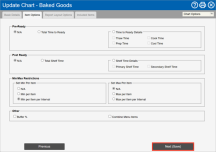
In the Item Options tab of the Update Chart window:
-
If you'd like the calculations to take into consideration the time it takes for the items to be prepared, select Total Time to Ready or Time to Ready Details.
-
If you selected Time to Ready Details, place a checkmark next to each preparation category that you want included in the calculations.
-
-
If you'd like the calculations to take into consideration the shelf life of the items, select Total Shelf Time or Shelf Time Details.
-
If you selected Shelf Time Details, place a checkmark next to Primary Shelf Time and/or Secondary Shelf Time, as required.
-
-
Select from the options under Min/Max Restrictions to set a lower and upper limit for the production quantities
Turning this option on will override calculated figures that are outside the limits set.
-
Place a checkmark next to each of the options under Other that you'd like to include in the calculations.
-
Click on the Next (Save) button.
-
-
In the Report Layout Options tab of the Update Chart window:
-
Place a checkmark next to each of the options that you'd like displayed in the generated production charts.
-
Select between the options in 0 Value Intervals to determine how no demand for all items in an interval is treated.
-
Show All will not hide any rows/columns and will show the demand/production quantity as 0 in case there’s no demand.
-
Hide All will hide all rows/columns that don’t have any demand/production quantity across an interval.
-
Hide Only Start & End will hide all rows/columns that don’t have any demand/production quantity across intervals that are at the beginning or end of the chart.
-
-
Place a checkmark in each of the options that you’d like to turn on in Set Sub Rows/Columns.
-
On Hand will provide an additional row/column for each period. This row/column will be blank so that you can fill in the quantity of each item that you already have ready at the beginning of the interval.
-
Need will also include an additional row/column for each period. This row/column will be blank so that you can fill in the balance required to be produced after deducting the On Hand figure from the Demand figure.
-
Signature will add a blank row/column for each period for the employee responsible to initial in to confirm adherence to the production chart.
-
-
Click on the Next (Save) button.

-
-
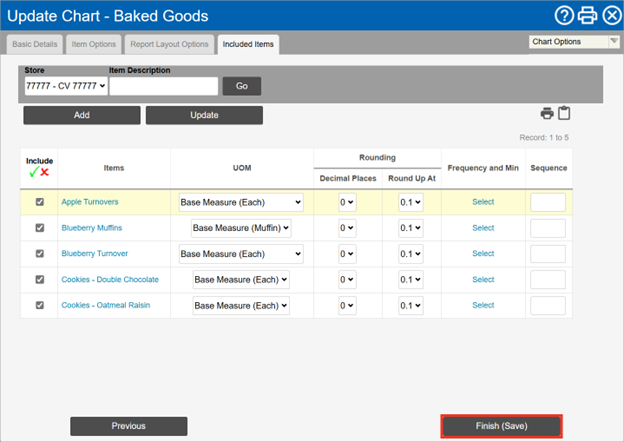
In the Included Items tab of the Update Chart window:
-
Select the Area* and Store and type in the Item Description if required, and then click on the Go button.
-
Click on the Add button.

-
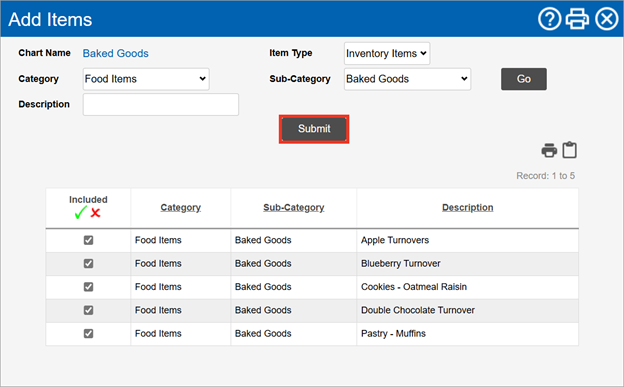
In the Add Items window:
-
Select whether the item you want to add is an Inventory Item or a Menu Item from the Item Type* drop-down list.
-
Select the Category* or Group* of the item.
-
Select the Sub-Category* or Mix* of the item.
-
Type in a part of or the whole name of the item in Description if required.
-
Click on the Go button.
-
Place a checkmark next to each item that you want to include in the production chart.
-
Click on the Submit button.

If the items flow over to two or more pages, click on the Submit button on each page before moving to the next. Items selected on a page will not be saved if you move to another page without clicking on the Submit button first.
-
-
Repeat steps b and c to add more items.
-
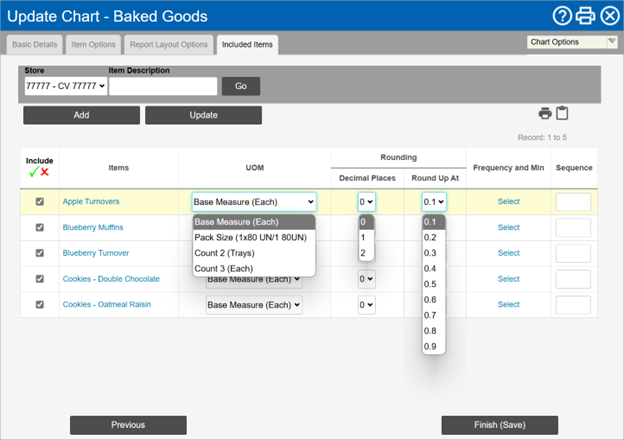
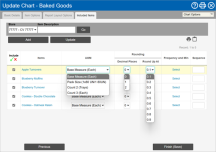
Remove the checkmark from the Include* column to remove an item from the chart.
-
Select the unit of measurement in which you want all quantities of the item displayed from the UOM drop-down list.
-
If you'd like the quantity of the item to be displayed as whole numbers only, select 0 from the Decimal Places drop-down list, else select 2.
-
Select at what value you'd like the quantity rounded up from the Round Up At drop-down list.
-
Click on a link in the Frequency* column.
Click on the How to Use? link in the top-right corner of the opened window for detailed instructions or refer to the steps below.
-
In the Frequency window, click to mark each time period that you want each of the items prepared.
-
Click on the Update button in the Frequency window.
-
Click on
 in the Frequency window.
-
-
Click on a link in the Frequency and Min* column.
NOTE: The present example uses User Defined as the Demand Frequency in the Basic Details tab, and Min per Item per Interval in the Item Options tab. As a result, the Frequency and Min column is displayed, and the time frames for expected demand must be defined, as shown below. The other types of frequency columns in the following instruction correspond to options selected in the Item Options tabs. Steps will be similar to those shown here.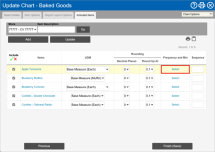
Click on the How to Use? link in the top-right corner of the opened window for detailed instructions or refer to the steps below.
-
In the Frequency and Min window, enter the minimum quantity required for each time period.
If you don't want an item prepared during a time period, leave the time period for the item blank.
-
Click on the Update button in the Frequency and Min window.
-
Click on
in the Frequency and Min window.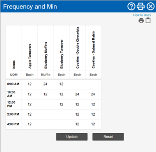
-
-
Click on a link in the Frequency and Max* column.
Click on the How to Use? link in the top-right corner of the opened window for detailed instructions or refer to the steps below.
-
In the Frequency and Max window, enter the maximum quantity required for each time period.
If you don't want an item prepared during a time period, leave the time period for the item blank.
-
Click on the Update button in the Frequency and Max window.
-
Click on
in the Frequency and Max window.
-
-
Click on a link in the Frequency and Min/Max* column.
Click on the How to Use? link in the top-right corner of the opened window for detailed instructions or refer to the steps below.
-
In the Frequency and Min/Max window, enter the minimum and maximum quantity (in the form of minimum quantity - maximum quantity) you want ready for each time period.
-
To set a minimum quantity only (no maximum quantity) for a time period, only enter the minimum quantity for the time period.
-
To set a maximum quantity only (no minimum quantity) for a time period, enter 0 - maximum quantity for the time period.
-
If you don't want an item prepared during a time period, leave the time period for the item blank.
-
-
Click on the Update button in the Frequency and Min/Max window.
-
Click on
in the Frequency and Min/Max window.
-
-
If the Maximum* column contains a text box, enter the maximum quantity you want ready for every time period, irrespective of the forecasted demand.
-
If the Maximum* column contains a link, click on the link.
Click on the How to Use? link in the top-right corner of the opened window for detailed instructions or refer to the steps below.
-
In the Maximum window, enter the maximum quantity you want ready for each time period, irrespective of the forecasted demand.
-
Click on the Update button in the Maximum window.
-
Click on
in the Maximum window.
-
-
If the Minimum* column contains a text box, enter the minimum quantity you want ready for every time period, irrespective of the forecasted demand.
-
If the Minimum* column contains a link, click on the link.
Click on the How to Use? link in the top-right corner of the opened window for detailed instructions or refer to the steps below.
-
In the Minimum window, enter the minimum quantity you want ready for each time period, irrespective of the forecasted demand.
-
Click on the Update button in the Minimum window.
-
Click on
in the Minimum window.
-
-
Click on a link in the Min/Max* column.
Click on the How to Use? link in the top-right corner of the opened window for detailed instructions or refer to the steps below.
-
In the Min/Max window, enter the minimum and maximum quantity (in the form of minimum quantity - maximum quantity) you want ready for each time period.
-
To set a minimum quantity only (no maximum quantity) for a time period, only enter the minimum quantity for the time period.
-
To set a maximum quantity only (no minimum quantity) for a time period, enter 0 - maximum quantity for the time period.
-
-
Click on the Update button in the Min/Max window.
-
Click on
in the Min/Max window.
-
-
Enter the amount of time required to thaw in the item in Thaw Time*.
-
Enter the amount of time required to cook 1 UOM of the item in Cook Time*.
-
Enter the amount of time it takes to prep 1 UOM of the item in Prep Time*.
-
Enter the amount of time the item requires to cool before it can be served or used in Cool Time*.
-
Enter the total amount of time to get the item ready to serve or use in Total Time to Ready*.
-
Enter the maximum amount of time that the item can be kept (once its cooked or ready to serve) after which it can no longer be served to a customer in Primary Shelf Time*.
-
Enter the maximum amount of time that the item can be kept (once its cooked or ready to serve) after which it can no longer be used for a secondary purpose (for example, as an ingredient in another menu item) in Secondary Shelf Time*.
-
Enter the percentage of extra quantity (over the forecasted demand) that you'd like to have ready in Buffer %*.
-
Enter a number in Sequence (this number determines the order in which the items will appear in the production chart).
-
-
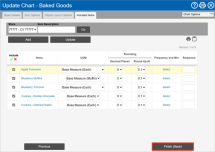
Click on the Finish (Save) button.
-
Click on the Update button.
If a chart similar to the one you want to create already exists, you can speed up the process by copying and editing the chart.
-
Production figures calculated are based on the demand that's been determined for each period. Two options can be selected from under demand frequency: