
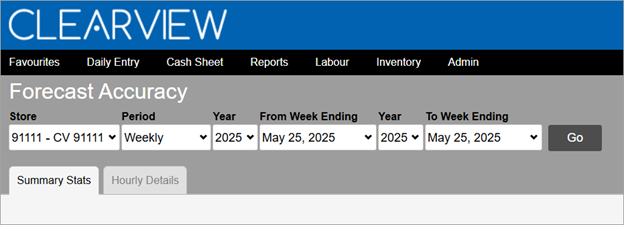
Forecast Accuracy
The Forecast Accuracy page compares past forecasts with the actual sales of a store to estimate how accurate your forecasts were.
Forecast Accuracy provides insight into the quality of the forecast created for a period. You can evaluate how well your forecasts align with actual outcomes.
TO VIEW A FORECAST ACCURACY REPORT:
-
Open the Forecast Accuracy page.
-
Select the Area* and Store for which you want to view the report from the drop-down list(s).
-
Select the Period for which you want to view the report from the drop-down list.
-
Select the specifics of the period* (Date*, Year*, From Week Ending*, To Week Ending*) from the drop-down list(s).
-
Click on the Go button.
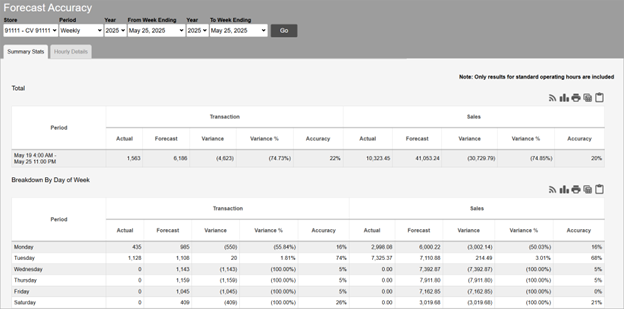
The following information is displayed in the Summary Stats and Hourly Details tabs for the Area*, Store and Period selected:
-
Period: The period (total period selected, week*, day of the week*, day part, rush period* or hour) for which the data is provided.
-
Transaction*:
-
Actual*: The actual number of transactions recorded during the period.
-
Forecast*: The number of transactions that were expected during the period based on the forecast.
-
Variance*: The difference between the actual number of transactions and that forecasted.
Variance = Actual - Forecast
-
Variance %*: The percentage difference between the actual number of transactions and that forecasted.
Variance % = Variance x 100 / Forecast
-
Accuracy*: Indicates the percentage of hourly periods that meet the accuracy threshold set.
Click here to learn how to set the Hourly Accuracy Assessment mode in Forecasting.
-
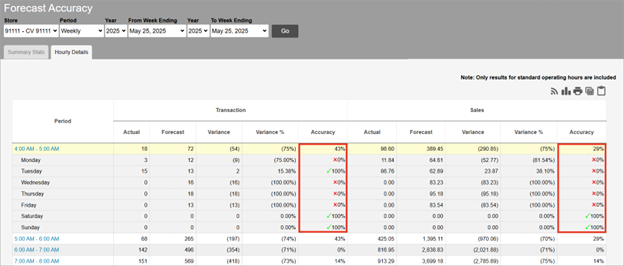
For hour periods for a single day (not grouped by day of the week or entire period) in the Hourly Details tab, the accuracy will either be 100% (indicating that the forecast was within the accuracy range of the actual results, and is hence considered as accurate) or 0% (indicating that the forecast was outside the accuracy range of the actual results, and is hence considered as inaccurate).
These periods include a
 before the 100% or
  before the 0% to indicate accurate or inaccurate, respectively.
-
For all other periods, it is the percentage of hour periods (that make up the period) that were accurate.
EXAMPLE
In the Breakdown By Day Part table, if the dinner day part constitutes two hours, for a one week report Accuracy is the perecentage of hour periods in the 14 total hour periods (2 hours a day x 7 days a week) that were considered accurate.
Click on the images on the right to view a visual of the example.


-
-
-
Sales*:
-
Actual*: The actual amount of sales recorded during the period.
-
Forecast*: The amount of sales that was expected during the period based on the forecast.
-
Variance*: The difference between the actual amount of sales and that forecasted.
Variance = Actual - Forecast
-
Variance %*: The percentage difference between the actual amount of sales and that forecasted.
Variance % = Variance x 100 / Forecast
-
Accuracy*: Indicates the percentage of hourly periods that meet the accuracy threshold set.
Click here to learn how to set the Hourly Accuracy Assessment mode in Forecasting.
-
For hour periods for a single day (not grouped by day of the week or entire period) in the Hourly Details tab, the accuracy will either be 100% (indicating that the forecast was within the accuracy range of the actual results, and is hence considered as accurate) or 0% (indicating that the forecast was outside the accuracy range of the actual results, and is hence considered as inaccurate).
These periods include a
before the 100% or before the 0% to indicate accurate or inaccurate, respectively. -
For all other periods, it is the percentage of hour periods (that make up the period) that were accurate.
EXAMPLE
In the Breakdown By Day Part table, if the dinner day part constitutes two hours, for a one week report Accuracy is the perecentage of hour periods in the 14 total hour periods (2 hours a day x 7 days a week) that were considered accurate.
Click on the images on the right to view a visual of the example.
-
-
-
Total: The total of each column is provided only in the Hourly Details tab.


Click here to learn how to select the totalling method for the Variance column in Forecasting.