
Forecasting Interface
The Forecasting page is where you can generate and view your financial and product mix forecasts, and view the predicted transaction count and sales amounts displayed in Schedule - New.
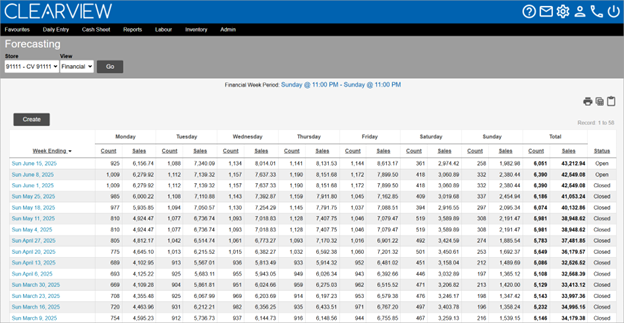
Forecasts generated take into consideration historical sales and product mix data, weather, events, promotions, and holidays and closures. Promotions that correspond with the forecast week can impact the forecast based on the controls selected. Additionally, the user can make adjustments to the forecast as per their discretion.
The historical data used to generate a forecast is taken from certain weeks called trend weeks Past weeks that can be considered the trend for the week being forecasted. The data of trend weeks is used in the calculation of forecasts.. Trend weeks are selected by your organization and/or the user that generated the forecast, and are meant to be previous weeks that represent the week being forecast.
Trend weeks Past weeks that can be considered the trend for the week being forecasted. The data of trend weeks is used in the calculation of forecasts. for the financial forecast and the product mix forecast are in two separate tabs and you can select different trend weeks Past weeks that can be considered the trend for the week being forecasted. The data of trend weeks is used in the calculation of forecasts. for each of them to account for different trends in expected transaction count and menu item sales.
The forecast for a week is made up of two parts:
-
Financial: Predicts the sales expected for the week, each day of the week, each part of the day and each time period.
-
Product Mix: Predicts the number of menu items (grouped by Product Group, Product Mix or individually as Menu Item) expected to be sold for the week and each day of the week.
Additionally, the schedule forecast - a by-product of the financial forecast, provides you with the financial figures used in Schedule - New.
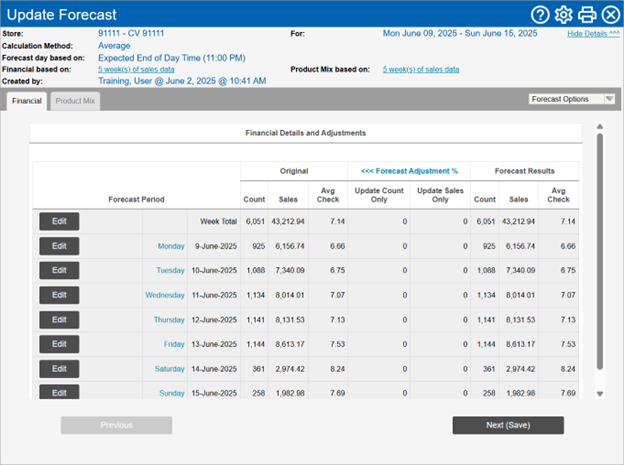
Financial
The following information is displayed on the Update Forecast page:
-
Forecast Period: The day, day part or time period of the forecast data.
-
Original:
-
Count: The number of transactions expected during the forecast period, before manual adjustments were made by users in your organization.
-
Sales: The total value of sales expected during the forecast period, before manual adjustments were made by users in your organization.
-
Avg. Check: The average value of each transaction for the period, before manual adjustments were made by users in your organization.
Avg. Check = Sales / Count
-
-
Forecast Adjustment: The percentage by which the forecast was manually adjusted by the user that generated the forecast.
A value in brackets indicates that the forecast was reduced by that percentage.
-
Update Count & Sales*: The percentage by which the count and sales were adjusted. A single figure indicates that both the count and sales were adjusted by the same percentage.
-
Update Count Only*: The percentage by which the count was adjusted.
-
Update Sales Only*: The percentage by which the sales was adjusted.
-
-
Forecast Results:
-
Count: The number of transactions expected during the forecast period after manual adjustments made by the user that generated the forecast.
-
Sales: The total value of sales expected during the forecast period after manual adjustments made by the user that generated the forecast.
-
Avg. Check: The average value of each transaction for the period after manual adjustments made by the user that generated the forecast.
Avg. Check = Sales / Count
-
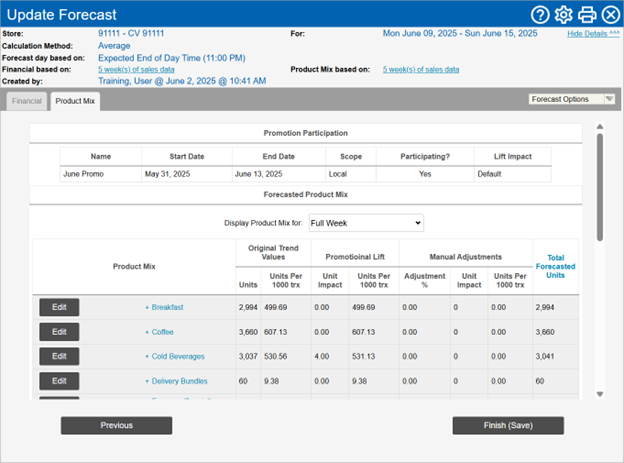
Product Mix
The following information is displayed on the Update Forecast page in the Forecasted Product Mix section:
-
Display Product Mix for: The period for which the information in the table is displayed.
-
Product Mix: The name of the product group, product mix or menu item.
-
Original Trend Values*:
-
Original Trend Units*/Units*: The units expected to be sold before manual adjustments made by the user that generated the forecast.
-
Units Per 1000 trx: The units expected to be sold per 1000 transactions before manual adjustments made by the user that generated the forecast
-
-
Promotional Lift*:
-
Promotional Lift Unit Impact*/Unit Impact*: The number of units by which the forecast is expected to increase (or decrease - in the case of numbers in brackets) due to promotions.
-
Units Per 1000 trx: The number of units by which the forecast is expected to increase (or decrease - in the case of numbers in brackets) per thousand transactions due to promotions.
-
-
Manual Adjustments: The adjustments made by the user that generated the forecast.
-
Adjustment %: The percentage by which the forecast was adjusted.
-
Unit Impact: The number of units by which the forecast was increased (or decreased - in the case of numbers in brackets).
-
Units Per 1000 trx*: The number of units by which the forecast was increased (or decreased - in the case of numbers in brackets) per 1000 transactions.
-
-
Total Forecasted Units: The total units forecasted for the day or week.
Total Forecasted Units = Original Trend Units + Promotional Lift Unit Impact + Manual Adjustment Unit Impact
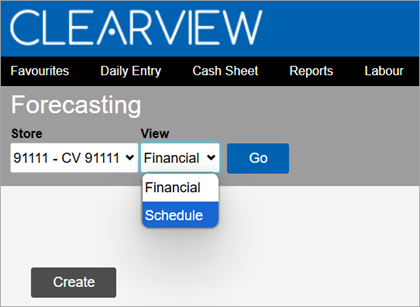
Schedule
While the financial data used for the Stats in Schedule - New is obtained from the financial forecast, if your scheduling week differs from your financial week (they start on different days of the week and/or time), looking at the financial forecast might not give you an accurate picture of the data used. The schedule forecast hence breaks the financial forecast down to the scheduling period so that you can see exactly what data was used for the Stats.
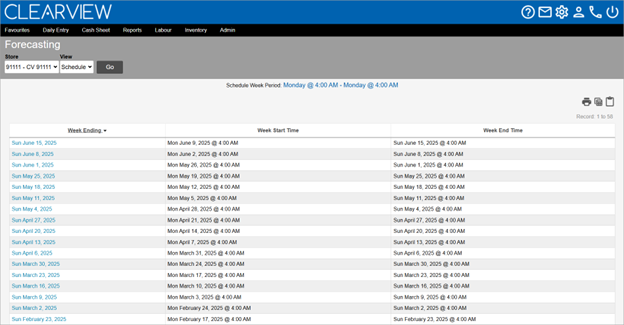
Select Schedule from the View drop-down list using the filters Drop-down boxes that let you select from the options available. at the top of the page to view a list of all the schedule forecasts.
The following information is displayed on the page:
-
Schedule Week Period: The start and end, date and time Unless specified otherwise, the date and time will always show in the user's local time. for which each forecast was generated.
-
Week Ending: The last day of the week of the forecast.
-
Week Start Time: The start date and time Unless specified otherwise, the date and time will always show in the user's local time. of the forecast.
-
Week End Time: The end date and time Unless specified otherwise, the date and time will always show in the user's local time. of the forecast.