
Actual Usage
The Actual Usage report tells you how much of your inventory was actually consumed during the period selected. Using the physical counts entered into CLEARVIEW, this report is based on the actual depletion of stock and is available as a cost report as well as quantity report.
Since the actual usage report is dependent on physical counts, the period of a report is from one count to another. Hence, only dates on which a physical count was performed can be set as the start and end date for reports. To generate a usage report for shorter periods or periods whose start or end dates are not dates on which a physical count was performed, you can generate a Theoretical Usage report. However, keep in mind that a theoretical usage The estimated usage of an inventory item based on menu item sales, recipes mapped to the menu items, sales assumptions and waste recorded. report does not use physical count data and estimates the usage based on different data (see theoretical usage), and hence isn't the same as an actual usage report.
TO GENERATE AN ACTUAL USAGE REPORT:
-
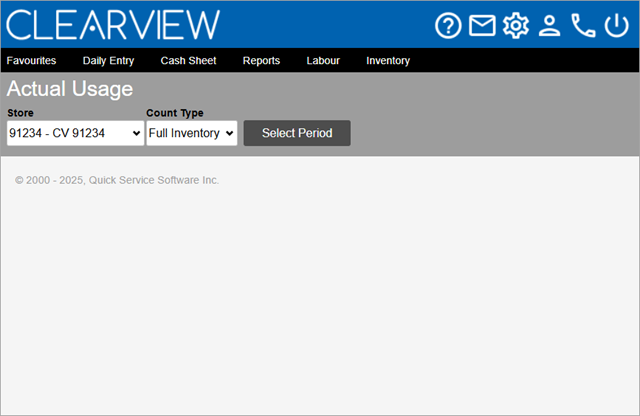
Open the Actual Usage page.

-
Select the Area* and Store for which you want to generate the actual usage from the drop-down list(s).
-
Select the Count Type from the drop-down list.
-
Full Inventory: Only dates on which a full inventory count was performed will be provided as options for the period to be selected.
-
Mini Inventory: Will include dates on which a full inventory count was performed as well as dates when mini inventory counts were performed. However, the report will be generated only for items included in the hot item sheets you select.
-
-
Click on the Select Period button.
If you created an actual usage report, theoretical usage report (using counts) or variance report recently, the period will already be set to the last period you selected. Clicking on the Select Period button will let you change the period.
-
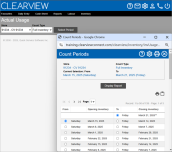
In the Count Periods window:
-
If you selected Mini Inventory in step 3, place a checkmark next to each of the Count Sheets* you want included in the report.
-
Select the start of the period for which you want to create the report from the Opening Inventory column.
-
Select the end of the period for which you want to create the report from the Closing Inventory column.
-
Click on the Display Report button.
-

Actual Usage by Cost Reports
Click on the Category Cost, Sub-Category Cost or Item Cost button to view the respective reports.

Clicking on a Category name in the Category Cost report will open the Sub-Category Cost report for that category in a new tab. Similarly, clicking on a Sub-Category name in a Sub-Category Cost report will open the Item Cost report for that sub-category in a new tab.
The actual usage by cost report displays the following information:

-
Store: The name of the store for which the report was generated.
-
Count Type:
-
Full Inventory: Indicates that all inventory items were included when generating the report.
-
Mini Inventory: Indicates that the report was generated for only inventory items included in the count sheet(s) selected.
-
-
Period: The start and end date for which the report was generated.
-
Category*: The category under which the sub-categories in the report fall.
-
Sub-Category*: The sub-category under which the items in the report fall.
-
The sales for the period is displayed as either Net Sales for the Period*, Gross Adjusted for the Period* or PLU Sales for the Period* (depending on the option selected), it provides the respective sales figure for the period.
Click here to learn how to choose which sales amount to use in calculations in Inventory Reporting.
-
Category*, Sub-Category* or Item*: The category, sub-category or inventory item consumed during the period.
-
Value of Opening Inventory: The value of the inventory that was in stock at the store on the first day of the period.
-
Purchases: The value of stock purchases invoiced during the period.
-
Transfers: The value of stock transferred to/from the store during the period.
Negative figures indicate stock transfers that have gone out of the store, while positive figures are stock transfers that have come in to the store.
-
Value of Closing Inventory: The value of the inventory that was in stock at the store on the last day of the report period. It is calculated on FIFO First In First Out - an assumption that the oldest items are used first and hence costed accordingly. basis, however, if the physical count on the last day of the period is not Closed, the value of the stock is determined based on blended pricing - the average price per case invoiced during the period and the average price per case transferred during the period.
-
Cost of Goods Sold: The cost of stock consumed during the period.
Cost of Goods Sold = Value of Opening Inventory + Purchases + Transfers - Closing Inventory
-
Percentage of Sales: The percentage of sales# that the cost of the inventory used forms.
Percentage of Sales = Cost of Goods Sold / Sales#
Report links:
-
Clicking on a Category name in the Category Cost report will open the Sub-Category Cost report for that category in a new tab.
-
Clicking on a Sub-Category name in a Sub-Category Cost report will open the Item Cost report for that sub-category in a new tab.
-
Clicking on a link in the Value of Opening Inventory or Value of Closing Inventory column will provide the break-up of the quantity and value of how much of the item was counted and how much was in assembled form (if the inventory item is used as an ingredient for a prepared item Items prepared in-house as opposed to purchased from a suuplier. For example, a special sauce that you might make in-house.).
Figures that are links are only available if the Opening Inventory date is not older than 45 days.
Actual Usage by Quantity Reports
Click on the View Complete Report button to view the report for all items or click on the name of a sub-category to view the report for items listed in that sub-category.
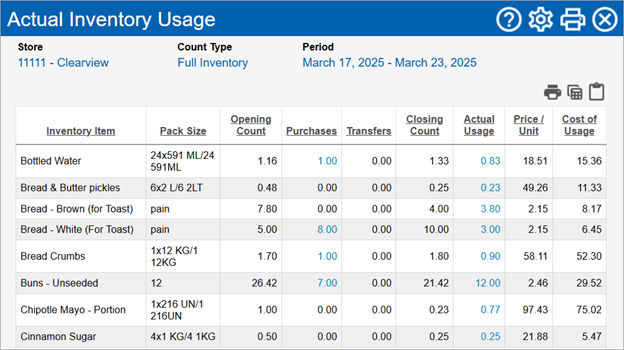
The actual usage by quantity report displays the following information:
-
Store: The name of the store for which the report was generated.
-
Count Type:
-
Full Inventory: Indicates that all inventory items were included when generating the report.
-
Mini Inventory: Indicates that the report was generated for only inventory items included in the count sheet(s) selected.
-
-
Period: The start and end date for which the report was generated.
-
Inventory Item: The inventory item consumed during the period.
-
Pack Size: The unit of measurement set as your preferred reporting method in CLEARVIEW. All quantities of the item are displayed in this unit of measurement on the report.
Click here to learn how to change the reporting method (package size) in Supplier Product An inventory item in a package size available from a particular supplier..
-
Opening Count:The quantity of the item in stock on the first day of the period.
-
Purchases:The quantity of the item received from the supplier, and invoiced during the period.
-
Transfers:The quantity of item transferred with other stores during the period.
Negative figures indicate stock transfers that have gone out of the store, while positive figures are stock transfers that have come in to the store.
-
Closing Count:The quantity of the item in stock on the last day of the report period.
-
Actual Usage: The quantity of the item consumed during the period.
Actual Usage = Opening Count + Purchases + Transfers - Closing Count
-
Price/Unit: The cost of one pack size of the item.
-
For full inventory actual usage reports it is calculated using the FIFO First In First Out - an assumption that the oldest items are used first and hence costed accordingly. method and may not reflect the most recent invoiced price.
-
For mini inventory actual usage reports it is the most recent invoiced price.
-
-
Cost of Usage: The cost of the items consumed during the period.
Cost of Usage = Actual Usage x Price per Unit