
Theoretical Usage
The Theoretical Usage report tells you how much of your inventory was theoretically consumed during the period selected. Theoretical usage The estimated usage of an inventory item based on menu item sales, recipes mapped to the menu items, sales assumptions and waste recorded. is estimated based on menu item sales, recipes mapped to the menu items, sales assumptions and waste recorded, and is available as a cost report as well as quantity report.
Since theoretical usage estimates usage based on sales, purchases, waste, etc. this report is only as accurate as the data recorded in CLEARVIEW.
Theoretical usage reports can be generated in two modes:
-
Count: Similar to actual usage reports, the period to be selected is limited to physical count dates.
Close any open physical counts before generating a report in this mode to ensure accuracy.
-
Usage: Lets you pick from the following period options:
-
Daily: Will generate the report for the business day The end of day (as set in Stores settings) of one day to the end of day of the subsequent day. For example, if the end of day set in the Stores settings is 9 pm, 9 pm Monday to 9 pm Tuesday will be considered as a business day. selected.
-
Weekly: Will generate the report for the week selected.
Weeks are clubbed under the years in which they begin.
-
Monthly: Will generate the report for the month selected.
-
Specified Period: Lets you select the start and end date of the period for which the report will be generated.
-
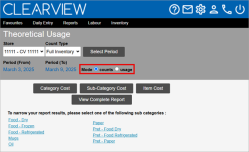
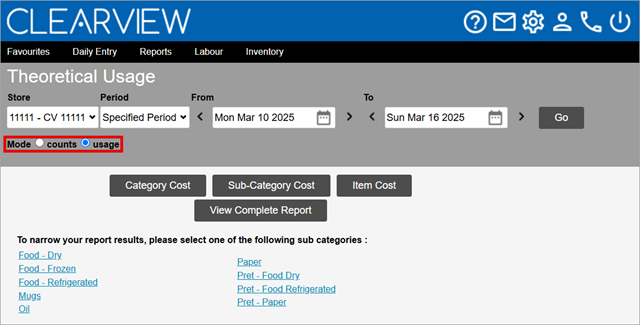
TO GENERATE A THEORETICAL USAGE REPORT FOR A COUNT PERIOD:
-
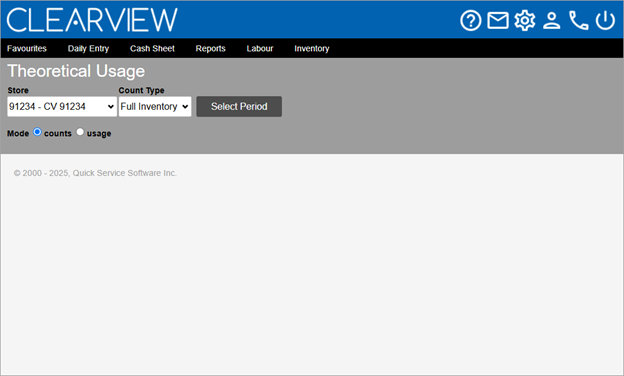
Open the Theoretical Usage page.

-
Set the Mode to counts.
-
Select the Area* and Store for which you want to view the theoretical usage The estimated usage of an inventory item based on menu item sales, recipes mapped to the menu items, sales assumptions and waste recorded. from the drop-down list(s).
-
Select the Count Type from the drop-down list.
-
Full Inventory: Only dates on which a full inventory count was performed will be provided as options for the period to be selected.
-
Mini Inventory: Will include dates on which a full inventory count was performed as well as dates when mini inventory counts were performed. However, the report will be generated only for items included in the hot item sheets you select.
-
-
Select what data you want to use from the Get Theoretical From* drop-down list:
-
End Day Data: Only dates on which counts performed as of the end of day Completion of end of day tasks on the POS which results in EOD markers sent to Clearview. will be provided as options for the period to be selected.
-
Live Data: Will include dates and times on which mid-day counts Physical counts performed for hot items in the middle of the workday (option available based on the POS system used and the Store settings). were performed in addition to the above data.
-
-
Click on the Select Period button.
If you created an actual usage report, theoretical usage report (using counts) or variance report recently, the period will already be set to the last period you selected. Clicking on the Select Period button will let you change the period.
-
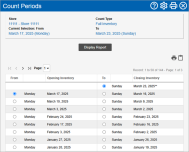
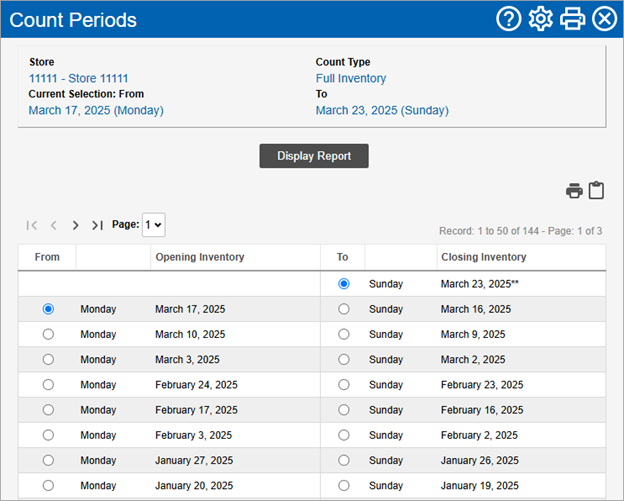
In the Count Periods window:
-
If you selected Mini Inventory in step 4, place a checkmark next to each of the Count Sheets you want included in the report.
-
Select the start of the period for which you want to create the report from the Opening Inventory column.
-
Select the end of the period for which you want to create the report from the Closing Inventory column.
-
Click on the Display Report button.
-

TO GENERATE A THEORETICAL USAGE REPORT FOR ANY PERIOD:
-
Open the Theoretical Usage page.
-
Set the Mode to usage.

-
Select the Area* and Store for which you want to view the theoretical usage The estimated usage of an inventory item based on menu item sales, recipes mapped to the menu items, sales assumptions and waste recorded..
-
Select the type of Period from the drop-down list.
-
Select the specifics of the period from the options available.
-
Click on the Go button.
Theoretical Inventory Usage by Cost Reports
Click on the Category Cost, Sub-Category Cost or Item Cost button to view the respective reports.
Clicking on a Category name in the Category Cost report will open the Sub-Category Cost report for that category in a new tab. Similarly, clicking on a Sub-Category name in a Sub-Category Cost report will open the Item Cost report for that sub-category in a new tab.
The theoretical inventory usage by cost report displays the following information:
-
Store: The name of the store for which the report was generated.
-
Period: The start and end date for which the report was generated.
-
Get Theoretical From*:
-
Live Data indicates that the period selected might include mid-day counts Physical counts performed for hot items in the middle of the workday (option available based on the POS system used and the Store settings)..
If the period start or end date is a mid-day count Physical counts performed for hot items in the middle of the workday (option available based on the POS system used and the Store settings)., the date will include the time-stamp of the count.
-
End Day Data indicates that the period selected only includes counts as of the end of the day for the start and end dates.
-
-
Category*: The category under which the sub-categories in the report fall.
-
Sub-Category*: The sub-category under which the items in the report fall.
-
The sales for the period is displayed as either Net Sales for the Period*, Gross Adjusted for the Period* or PLU Sales for the Period* (depending on the option selected), it provides the respective sales figure for the period.
Click here to learn how to choose which sales amount to use in calculations in Inventory Reporting.
-
Category*, Sub-Category* or Item*: The category, sub-category or inventory item consumed during the period.
-
Usage Cost: The total cost of the inventory item consumed during the period. It is calculated based on the quantity of the inventory item used (as per the recipe in CLEARVIEW) in each menu item sold during the period, and adjusted for sales assumptions.
-
Usage %: The percentage of sales# that the inventory item consumed forms.
Usage % = Usage Cost x 100 / Sales# for the Period
-
Waste Cost: The total value of the inventory item wasted as recorded in the Daily Waste page for the period.
-
Waste %: The percentage of sales# that the inventory item wasted forms.
Waste % = Waste Cost x 100 / Sales# for the Period
-
Total Cost: The theoretical cost of the items consumed during the period.
Total Cost = Usage Cost + Waste Cost
-
Total %: The percentage of sales# that the theoretical cost of inventory used forms.
Total % = Total Cost x 100 / Sales# for the Period
Report links:
-
Clicking on a Category name in the Category Cost report will open the Sub-Category Cost report for that category in a new tab.
-
Clicking on a Sub-Category name in a Sub-Category Cost report will open the Item Cost report for that sub-category in a new tab.
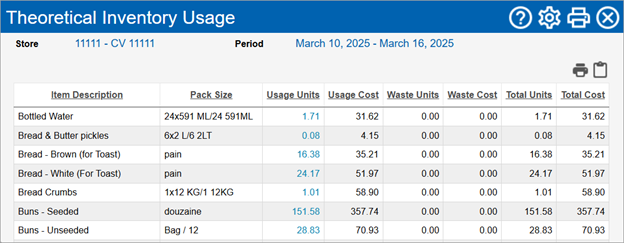
Theoretical Inventory Usage by Quantity Reports
Click on the View Complete Report button to view the report for all items or click on the name of a sub-category to view the report for items listed in that sub-category.
The theoretical inventory usage by quantity report displays the following information:
-
Store: The name of the store for which the report was generated.
-
Period: The start and end date for which the report was generated.
-
Get Theoretical From*:
-
Live Data indicates that the period selected might include mid-day counts Physical counts performed for hot items in the middle of the workday (option available based on the POS system used and the Store settings)..
If the period start or end date is a mid-day count Physical counts performed for hot items in the middle of the workday (option available based on the POS system used and the Store settings)., the date will include the time-stamp of the count.
-
End Day Data indicates that the period selected only includes counts as of the end of the day for the start and end dates.
-
-
Item Description: The inventory item consumed during the period.
-
Pack Size: The unit of measurement set as your preferred reporting method in CLEARVIEW. All quantities of the item are displayed in this unit of measurement on the report.
Click here to learn how to change the reporting method (package size) in Supplier Product An inventory item in a package size available from a particular supplier..
-
Usage Units: The quantity of the inventory item consumed through menu items sold during the period (as per the recipes in CLEARVIEW), and adjusted for sales assumptions.
-
Click here to learn how to find and view Recipes.
-
Click here to learn how to view and change Sales Assumptions.
-
-
Usage Cost: The total cost of the inventory item consumed during the period.
Usage Cost = Usage Units x Cost of one unit of the Inventory Item
-
Waste Units: The total quantity of the inventory item wasted as recorded in the Daily Waste page for the period.
-
Waste Cost: The total cost of the inventory item wasted during the period.
Waste Cost = Waste Units x Cost of one unit of the Inventory Item
-
Total Units: The total quantity of the inventory item consumed during the period.
Total Units = Usage Units + Waste Units
-
Total Cost: The total cost of the units of the inventory item consumed.
Total Cost = Usage Cost + Waste Cost
Report links:
-
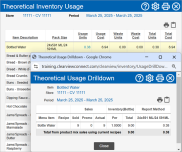
Clicking on a link figure in the Usage Units column will open the Theoretical Usage Drilldown window.
-
Clicking on a link figure in the Waste Units column will open the Waste Drill-down window.


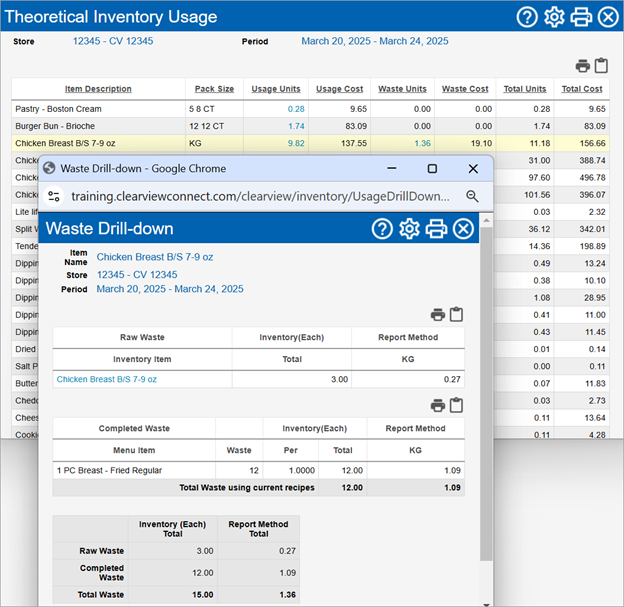
Figures that are links are only available if the Opening Inventory date is not older than 45 days.