
Variance Report
The Variance Report is an analysis tool that compares the actual usage with the theoretical usage (and includes waste), for a period and calculates the difference between the two. It's available as a cost report and as a quantity report.
The variance report with waste shows the discrepancies between the theoretical usage The estimated usage of an inventory item based on menu item sales, recipes mapped to the menu items, sales assumptions and waste recorded. (including waste) and actual usage figures. The smaller the difference between the two figures, the more likely your actual and theoretical usage The estimated usage of an inventory item based on menu item sales, recipes mapped to the menu items, sales assumptions and waste recorded. is accurate and vice versa.
The waste included in this report is that recorded through the Daily Waste page and not fixed/reoccurring waste. Fixed/reoccuring waste is in-built in the theoretical usage The estimated usage of an inventory item based on menu item sales, recipes mapped to the menu items, sales assumptions and waste recorded. figures.
Click here to learn how to edit, create and delete Waste - Fixed/Reoccurring.
TO GENERATE A VARIANCE REPORT WITH WASTE:
-
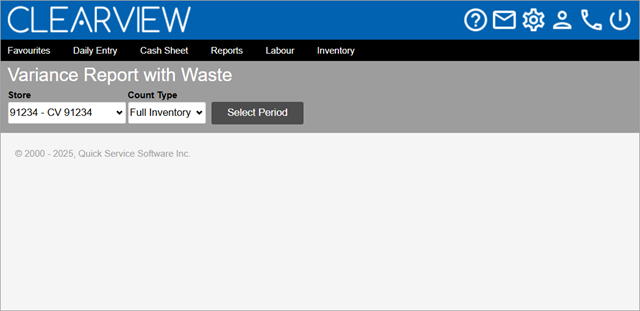
Open the Variance Report With Waste page.

-
Select the Area* and Store for which you want to view the variance with waste report from the drop-down list(s).
-
Select the Count Type from the drop-down list.
-
Full Inventory: Only dates on which a full inventory count was performed will be provided as options for the period to be selected.
-
Mini Inventory: Will include dates on which a full inventory count was performed as well as dates when mini inventory counts were performed. However, the report will be generated only for items included in the hot item sheets you select.
-
-
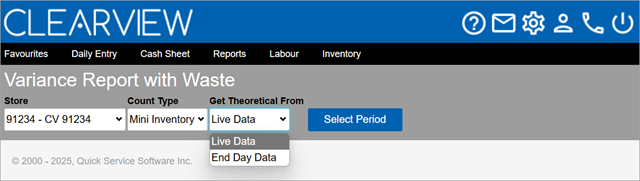
4. If you selected Mini Inventory, choose what data you want to use from the Get Theoretical From* drop-down list:

-
End Day Data: Only dates on which counts performed as of the end of day Completion of end of day tasks on the POS which results in EOD markers sent to Clearview. will be provided as options for the period to be selected.
-
Live Data: Will include dates and times on which mid-day counts Physical counts performed for hot items in the middle of the workday (option available based on the POS system used and the Store settings). were performed in addition to the above data.
NOTE: Live data is only available for 7 days.
-
-
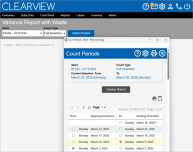
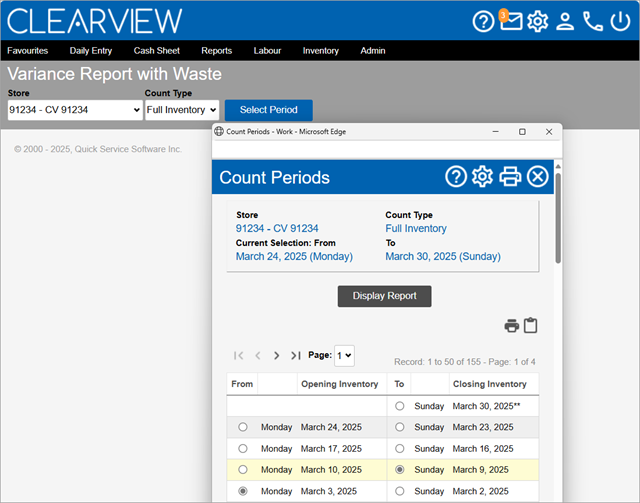
Click on the Select Period button.
If you created an actual usage report, theoretical usage report (using counts) or variance report recently, the period will already be set to the last period you selected. Clicking on the Select Period button will let you change the period.
-
In the Count Periods window:
-
If you selected Mini Inventory in step 3, place a checkmark next to each of the Count Sheets you want included in the report.
-
Select the start of the period for which you want to create the report from the Opening Inventory column.
-
Select the end of the period for which you want to create the report from the Closing Inventory column.
-
Click on the Display Report button.
-
Variance Report with Waste by Cost
Click on the Category Cost, Sub-Category Cost or Item Cost button to view the respective reports.
Clicking on a Category name in the Category Cost report will open the Sub-Category Cost report for that category in a new tab. Similarly, clicking on a Sub-Category name in a Sub-Category Cost report will open the Item Cost report for that sub-category in a new tab.
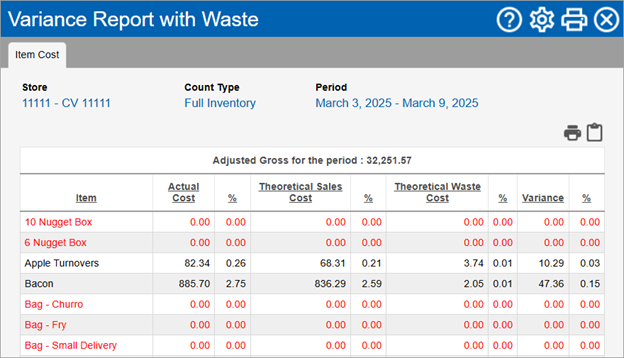
The variance report with waste by cost displays the following information:
-
Store: The name of the store for which the report was generated.
-
Count Type:
-
Full Inventory: Indicates that all inventory items were included when generating the report.
-
Mini Inventory: Indicates that the report was generated for only inventory items included in the count sheet(s) selected.
-
-
Period: The start and end date for which the report was generated.
-
The sales for the period is displayed as either Net Sales for the Period*, Gross Adjusted for the Period* or PLU Sales for the Period* (depending on the option selected), it provides the respective sales figure for the period.
Click here to learn how to choose which sales amount to use in calculations in Inventory Reporting.
-
Category*, Sub-Category* or Item*: The category, sub-category or inventory item consumed during the period.
-
Actual Cost: The cost of the items consumed during the period as per the actual usage report.
-
%: The percentage of sales# that the actual cost of inventory used forms.
% = Actual Cost / Sales#
-
Theoretical Cost: The cost of the items consumed during the period as per the theoretical usage The estimated usage of an inventory item based on menu item sales, recipes mapped to the menu items, sales assumptions and waste recorded. report.
-
%: The percentage of sales# that the theoretical cost of inventory used forms.
% = Theoretical Cost / Sales#
-
Theoretical Waste Cost: The cost of the waste recorded in the Daily Waste pages for the period.
-
%: The percentage of sales# that the theoretical waste forms.
% = Theoretical Waste Cost / Sales#
-
Variance: The difference between the actual cost and theoretical cost including waste.
Variance = Actual Cost - Theoretical Cost - Theoretical Waste Cost
-
%: The percentage of sales# that the variance forms.
% = Variance / Sales#
-
Inventory items whose theoretical usage The estimated usage of an inventory item based on menu item sales, recipes mapped to the menu items, sales assumptions and waste recorded. are not tracked are displayed in red and have their actual figures repeated in the theoretical columns. Their variance is hence always zero.
-
Costing for Mini Inventory reports is based on the latest purchase price as it is meant to reflect the cost as if the current pricing were applied to all usage in the count period. However, in the Full Inventory report, costs are calculated using FIFO First In First Out - an assumption that the oldest items are used first and hence costed accordingly..
The variance report with waste by cost data is also available in the Detailed version of the Variance Report with Waste by Quantity.
Report links:
-
Clicking on a Category name in the Category Cost report will open the Sub-Category Cost report for that category in a new tab.
-
Clicking on a Sub-Category name in a Sub-Category Cost report will open the Item Cost report for that sub-category in a new tab.
Click here to learn how to change the sales figure used in Inventory Reporting.
Variance Report with Waste by Quantity
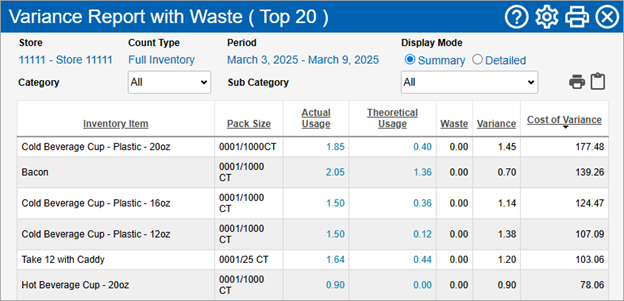
Click on the View Complete Report button to view the report for all items, the Top 20 button to view the report for the 20 items with the highest cost of variance, or click on the name of a sub-category to view the report for items listed in that sub-category.
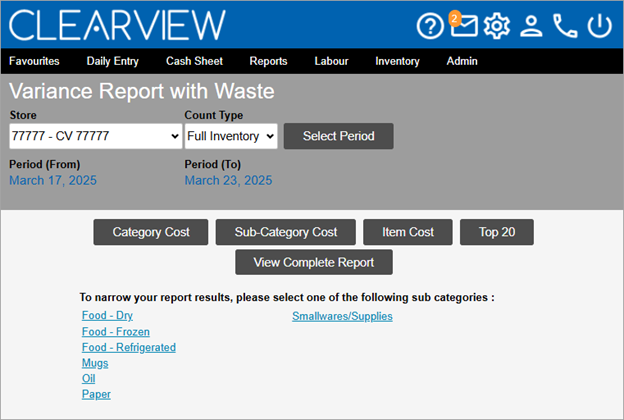
Use the Display Mode to switch between the Summary and Detailed view, and use the Category and Sub-Category drop-down lists to filter Drop-down boxes that let you select from the options available. the list of items in the report if required.
The detailed view of the report includes extra columns that break down the calculation of the Actual Usage*/Act Units* as well as the cost values of the actual usage, theoretical usage The estimated usage of an inventory item based on menu item sales, recipes mapped to the menu items, sales assumptions and waste recorded. and variance.
The variance report with waste by quantity displays the following information:
-
Store: The name of the store for which the report was generated.
-
Count Type:
-
Full Inventory: Indicates that all inventory items were included when generating the report.
-
Mini Inventory: Indicates that the report was generated for only inventory items included in the count sheet(s) selected.
-
-
Period: The start and end date for which the report was generated.
-
Get Theoretical From*:
-
Live Data indicates that the period selected might include mid-day counts Physical counts performed for hot items in the middle of the workday (option available based on the POS system used and the Store settings)..
If the period start or end date is a mid-day count Physical counts performed for hot items in the middle of the workday (option available based on the POS system used and the Store settings)., the date will include the time-stamp of the count.
-
End Day Data indicates that the period selected only includes counts as of the end of the day for the start and end dates.
-
-
The sales for the period is displayed as either Net Sales for the Period*, Gross Adjusted for the Period* or PLU Sales for the Period* (depending on the option selected), it provides the respective sales figure for the period.
Click here to learn how to choose which sales amount to use in calculations in Inventory Reporting.
-
Display Mode:
-
Summary: Indicates that only basic data pertaining to the quantity report is displayed.
-
Detailed: Indicates that the cost data and the details of the quantity report is displayed. Inventory items are also grouped by sub-category in this form of the report.
-
-
Category: Indicates the category for which the inventory items are displayed in the table.
-
Sub-Category: Indicates the sub-category for which the inventory items are displayed in the table.
-
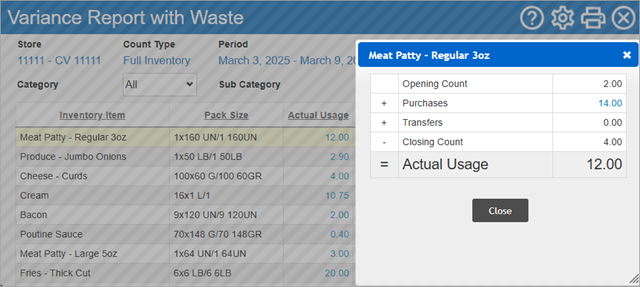
Inventory Item: The inventory item consumed during the period.
-
Pack Size: The unit of measurement set as your preferred reporting method in CLEARVIEW. All quantities of the item are displayed in this unit of measurement on the report.
Click here to learn how to change the reporting method (package size) in Supplier Product An inventory item in a package size available from a particular supplier..
-
Price/Unit*: The cost of one pack size of the item.
-
For full inventory actual usage reports it is calculated using the FIFO First In First Out - an assumption that the oldest items are used first and hence costed accordingly. method and may not reflect the most recent invoiced price.
-
For mini inventory actual usage reports it is the most recent invoiced price.
-
-
Open Count*: The physical count of the item on the first day of the period.
-
Purchases*: The quantity of the item received from the supplier during the period.
-
Transfers*: The quantity of item transferred with other stores during the period.
Negative figures indicate stock transfers that have gone out of the store, while positive figures are stock transfers that have come in to the store.
-
Close Count*: The physical count of the item on the last day of the report period.
-
Actual Usage* / Act Units*: The quantity of the items consumed during the period as per the actual usage report.
Actual Usage or Act Units = Open Count + Purchases + Transfers - Close Count
-
Theoretical Usage* / Theo Units*: The quantity of the items consumed during the period as per the theoretical usage The estimated usage of an inventory item based on menu item sales, recipes mapped to the menu items, sales assumptions and waste recorded. report.
-
Waste* / Waste Units*: The quantity of waste recorded in the Daily Waste pages for the period.
-
Variance* / Var Units*: The difference between the actual units and theoretical units including waste.
Variance = Actual Usage - Theoretical Usage - Waste
Var Units = Actual Units - Theoretical Units - Waste Units
-
Act Cost*: The cost of the items consumed during the period as per the actual usage report.
Act Cost = Price/Unit x Act Units
-
Theo Cost*: The cost of the items consumed during the period as per the theoretical usage The estimated usage of an inventory item based on menu item sales, recipes mapped to the menu items, sales assumptions and waste recorded. report.
Theo Cost = Price/Unit x Theo Units
-
Waste Cost*: The cost of the waste recorded in the Daily Waste pages for the period.
-
Cost of Variance* / $ Var*: The difference between the actual cost and theoretical cost including waste.
Cost of Variance or $ Var = Act Cost - Theo Cost
-
% Var*: The percentage of sales# that the variance forms.
% Variance = $ Var / Sales
Report links:
-
Clicking on a link figure in the Actual Usage column displays a pop-up with the calculation.

-
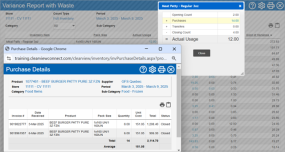
Clicking on a link figure in the Purchases column will open the Purchase Details window in which invoice details of the item for the report period are displayed.
-
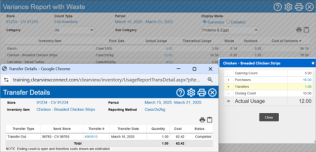
Clicking on a link figure in the Transfers column will open the Transfer Details window in which transfer details of the item for the report period are displayed.
-
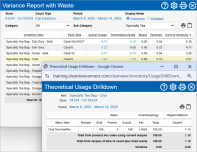
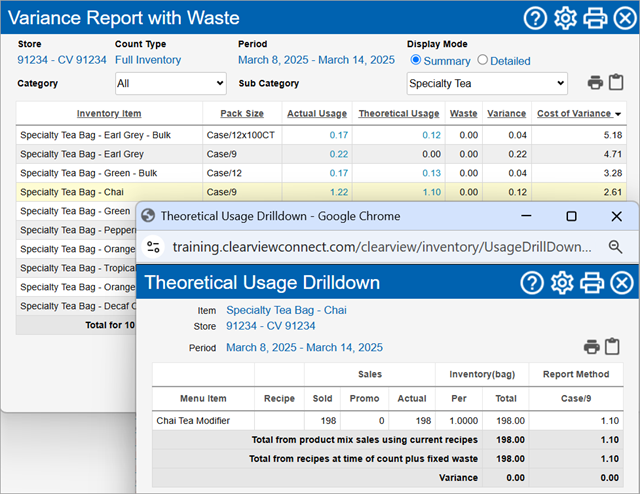
Clicking on a link figure in the Theoretical Usage / Theo Units column will open the Theoretical Usage Drilldown window.
-
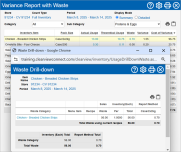
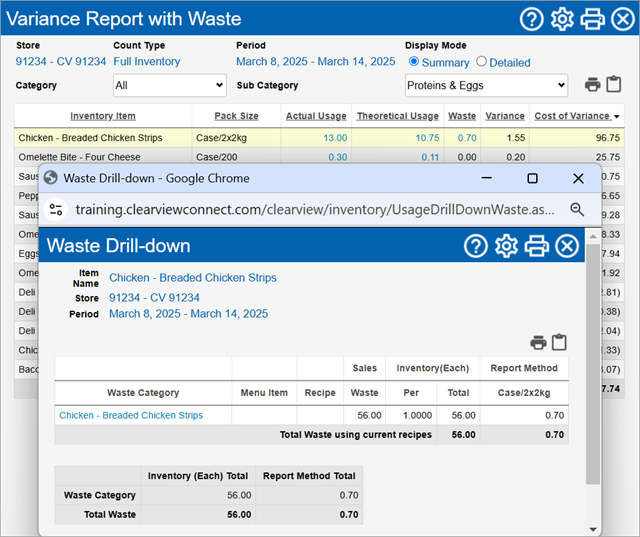
Clicking on a link figure in the Waste / Waste Units column will open the Waste Drill-down window.

Figures that are links are only available if the Open Inventory date is not older than 45 days.